Francis turbines play a major role in existing hydropower generation systems. Increasingly, they are also becoming an important area of development for energy storage, which is a key aspect of the process of decarbonisation. This is because further growth of renewable energy (wind/solar) in the grid depends on cost-effective and large-scale energy storage systems, for which Francis turbines are now increasingly considered as an option in the form of pump-turbine systems.
Over the years, ADT has helped many major customers streamline and speed up the design and optimization of Francis turbine stages, and has developed considerable fluid dynamic knowledge to design high-performance Francis turbines in the process systematically. Here is a summary of some of the main adverse fluid phenomena that cause drops in performance in Francis turbine stages.
Hydraulic Turbine Design Process
The first step in the design of any hydraulic turbine is to identify the required specific speed regime of the turbine. This will dictate the meridional shape and hence the general flow direction through the machine. For example, a low specific speed hydraulic turbine is likely to be a Pelton or Francis type, whereas a high specific speed one is likely to be of Kaplan or Bulb type.
From the required specific speed, we can identify the main flow phenomena and loss mechanisms dominant in that particular range (Figure 1). For example, leakage and secondary flow effects are more dominant in lower ranges, whereas profile losses take priority in the medium and higher ranges. It must be noted that a phenomenon such as cavitation can affect hydraulic turbines over the entire specific speed range and must be dealt with on a case basis.
From the information above we can use design tools and 3D CFD to investigate our turbine designs, what follows are a set of principal design guidelines based on the fluid dynamics considerations of reducing dominant flow losses for a given runner / vane.
Meanline Design of Francis Turbine Stage
Figure 1 contains the stage specifications, consisting of a volute, stay vanes, guide vanes, runner and a draft tube. From these specs, we can see that it is positioned very close to the Francis turbine band. This means that using these specs, designing a Francis turbine stage with a high-efficiency level should be possible.
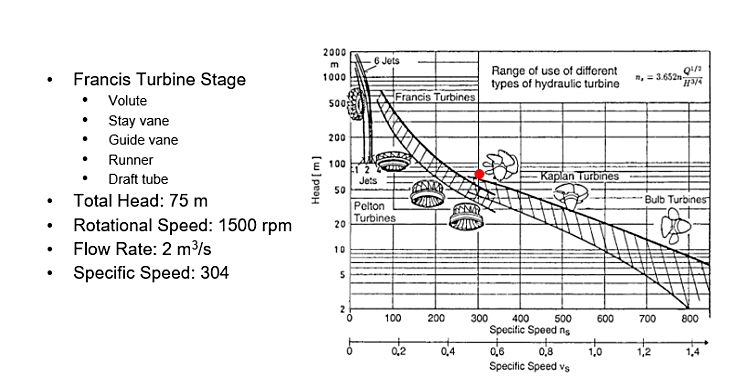
Figure 1: Francis turbine stage specifications and its position on the specific speed chart
Using the meanline code TURBOdesign Pre, it is very easy to enter the given specs, and then it quickly generates the meridional shape of the Francis turbine stage in less than a second. As Figure 2 shows, it also provides a detailed report including the estimated stage performance and some important dimensions, as well as the required rVt* for the stay vane, guide vane and runner. These rVt* values for the different components are equivalent to their work coefficients, and they will be used for the 3D inverse design of the vanes and the runner in the next section.
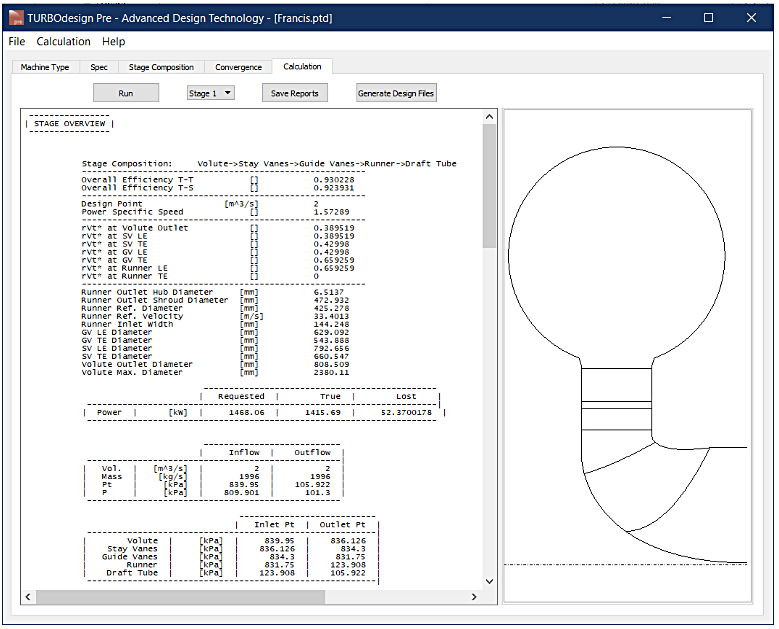
Figure 2: Meanline design of Francis turbine stage in TURBOdesign Pre
3D Blade Design of Stay/Guide Vanes and Runner
Figure 3 presents the setup for the baseline Francis turbine stage in our 3D inverse design software TURBOdesign1, and these axial chord distributions for the stay vane, guide vane and runner, they all come from the meanline code as we saw earlier. The spanwise work distribution for each component is a free vortex, so it has a constant value from hub to shroud. It is worth noting that the rVt* of the downstream leading edge is kept the same as the upstream trailing edge for all the components, ensuring a good match between them. The loading distribution is foreloaded for the stay vane, mid-loaded for the guide vane and for this baseline runner, it is fore-loaded at both hub and shroud. These inputs result in 3D geometries of the different components in their correct locations as shown alongside.
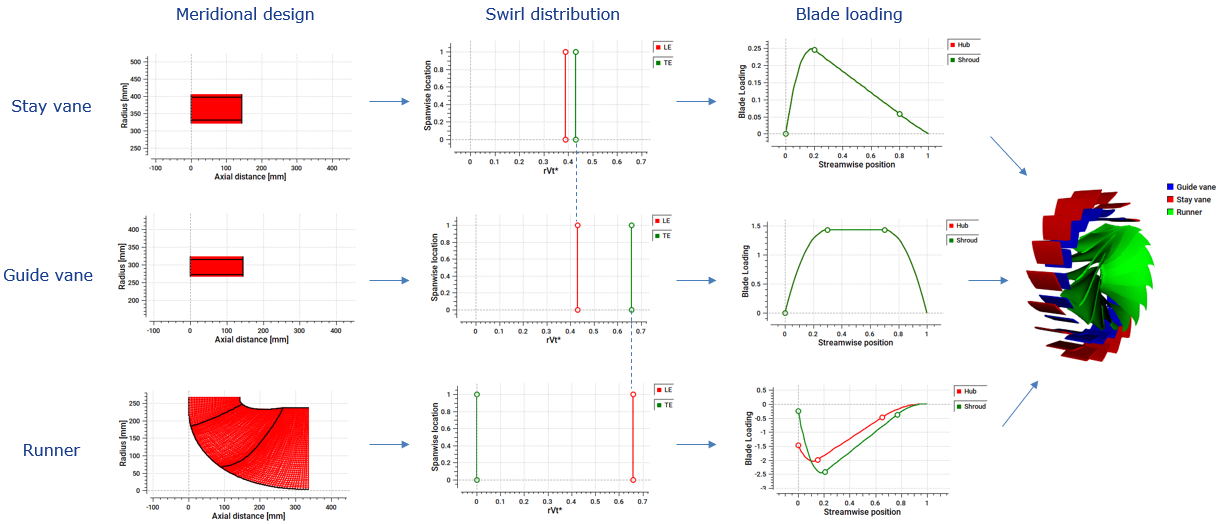
Figure 3: 3D blade design of stay/guide vanes and runner in TURBOdesign1
Volute Design
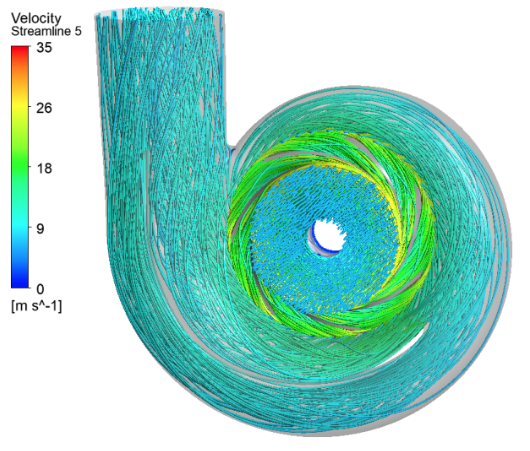
The meanline code TURBOdesign Pre also generates a volute report, and TURBOdesign Volute uses this information to design the volute for the Francis turbine as shown in Figure 4.
Figure 4: Volute design using TURBOdesign Volute
Draft Tube Design
Since TURBOdesign Pre also includes a draft tube in the meanline computations, this was designed as well. For this, some information from the meanline report and some from the literature was used to get the correct dimensions as shown in Figure 5. Using this, a conical diffuser draft tube was obtained with an acceptable cone half-angle of 5 degrees, of which a 90-degree sector was included in CFD calculations.
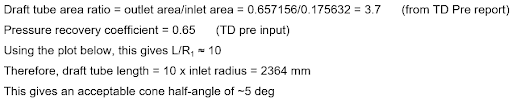
Figure 5: Draft tube design
Baseline Stage – CFD Setup
Once all the Francis turbine stage components were ready, a CFD analysis was run on the baseline stage to check the performance. The boundary conditions used in CFD were chosen to match the inlet conditions and mass flow rate from the TD1 case. Figure 6 shows that ANSYS TurboGrid was used for the fully structured grids of the runner and the vanes, ANSYS Mesh for the hybrid mesh of the volute and the draft tube, and CFX for the flow analysis.

Figure 6: Baseline Francis turbine stage CFD setup
Baseline Stage – Results
Figure 7 has the results for the baseline stage, where the TURBOdesign1 performance parameters show the profile loss and secondary flow indicators as well as the throat area value. Interestingly, the surface static pressure distribution from the inverse design shows a very negative minimum pressure, especially at the suction surface's front portion. This could mean a very strong possibility of cavitation in this region of the turbine.
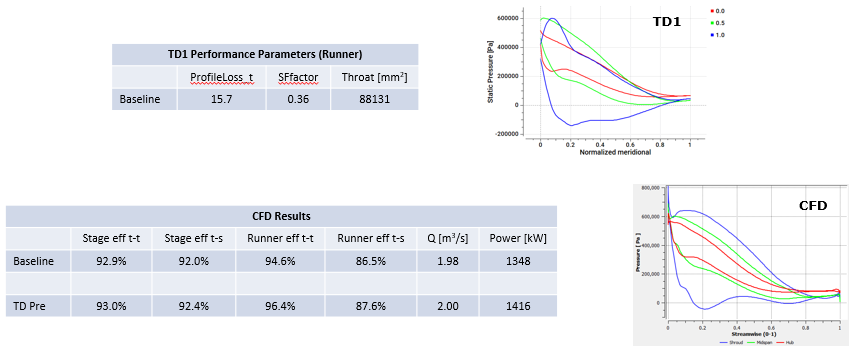
Figure 7: Baseline Francis turbine stage results
Also presented are the CFD results where both the total-to-total and total-to-static efficiency levels are very close to the meanline code estimation. Also, the flow rate is very close to the design value, meaning that the throat is not far from the correct size. However, CFD plots also show a negative minimum pressure in the same area further confirming the possibility of cavitation that was predicted by the inverse design.
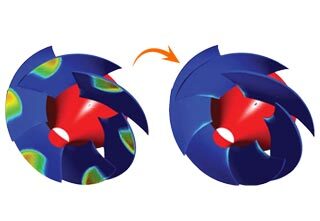
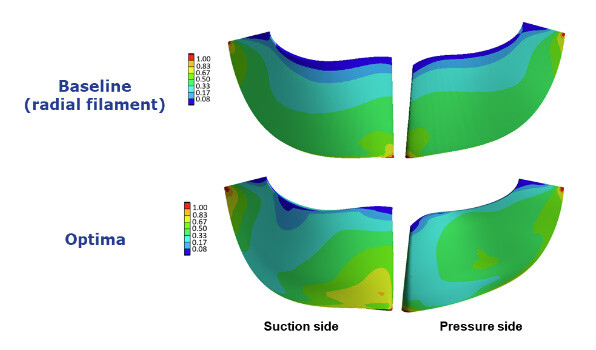
In another article, we demonstrate the use of the Optima feature in TURBOdesign1 to automatically optimize the baseline runner and enhance its performance by improving efficiency and removing the possibility of cavitation at the same time.

Book a LIVE demo on the design of a turbomachinery application of your choice.
Our demo is tailored to your specific application and design challenges

Share This Post