The fan design process generally starts with the chart shown in Figure 1 which provides the relationship between speed number and diameter number as experimentally found by Cordier. This relationship, called Cordier-line in the literature, represents a sort of “optimum” fans with high efficiency. So there is a relationship between the speed number or diameter number and the type of fan to be used, whether axial, diagonal or radial, in order to obtain high efficiencies.
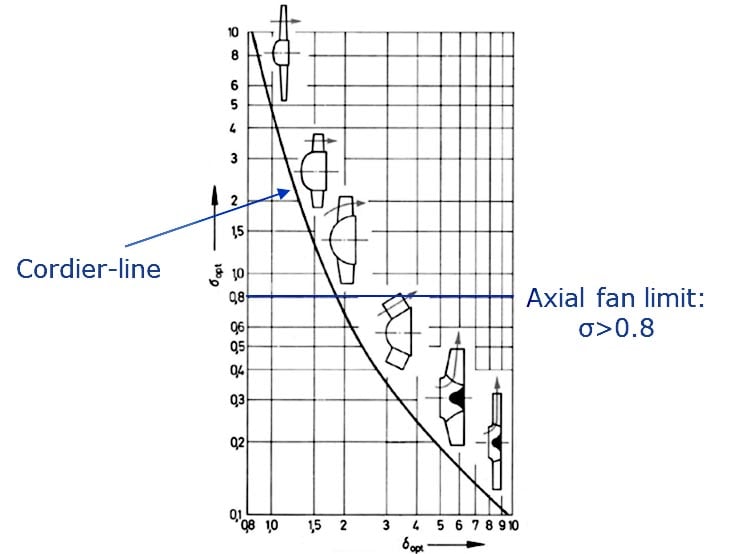
Figure 1: Cordier diagram for axial, diagonal and radial fans
We can identify the main flow phenomena and loss mechanisms dominant in that particular range from the required speed number. For example, tip leakage, profile losses and flow separation usually take priority when it comes to axial fans which is the topic of this study. We can use design tools and 3D CFD to investigate our fan designs from this information. What follows is a set of principal design guidelines based on the fluid dynamics considerations of reducing dominant flow losses for a given fan.
Baseline Fan
Figure 2 contains the baseline fan specifications that need to be redesigned in this study. It is basically a propeller-type rotor-only axial fan, and from these specs, we can see that the fan sits very close to the Cordier line and well within the axial fan speed number limit. This indicates that using these specs, it should be possible to design an axial fan with a high-efficiency level.
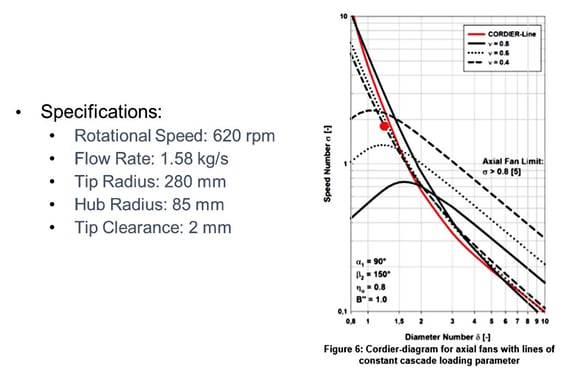
Figure 2: Baseline fan specifications and their position on the Cordier diagram
Baseline Fan - Meanline Design
Using the meanline code TURBOdesign Pre, it is very easy to enter the given specs and then quickly generate the fan's meridional shape in less than a second. As Figure 3 shows, it also provides a detailed report including the estimated total-to-total and total-to-static efficiencies, as well as the required rVt*at the hub, mid-span and shroud, which is equivalent to the working coefficient and will be used for the 3D inverse design of the blade in the next section.
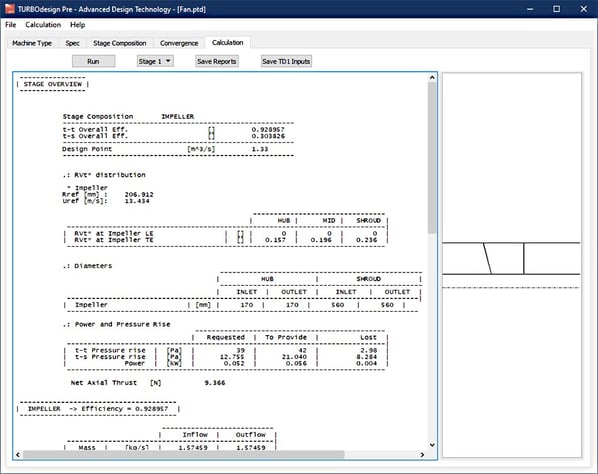
Figure 3: Meanline design of baseline fan in TURBOdesign Pre
Here's a Live Demo of the Meanline Design with TURBOdesign Pre
Baseline Fan - 3D Blade Design
Figure 4 presents the setup for the baseline fan in our 3D inverse design software TURBOdesign1, where the axial chord distribution comes from the meanline code as shown earlier. The spanwise rVt* is a forced vortex because it is low at the hub with a linear variation and high at the tip. It can also be seen that the loading distribution is fore-loaded at the shroud and aft-loaded at the hub. These inputs then result in the baseline fan's 3D geometry, which needs to be redesigned in this study.
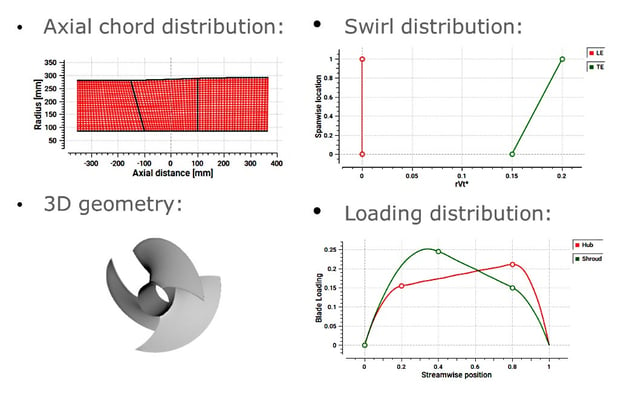
Figure 4: 3D blade design of baseline fan in TURBOdesign1
Baseline Fan – CFD Setup
Before starting the redesign process, CFD analysis was performed on the baseline fan to check its performance, and for this ANSYS TurboGrid was used for the fully-structured grid generation and CFX for the flow analysis. The boundary conditions used in CFD were chosen to match the inlet conditions and mass flow rate from the TURBOdesign1 case.
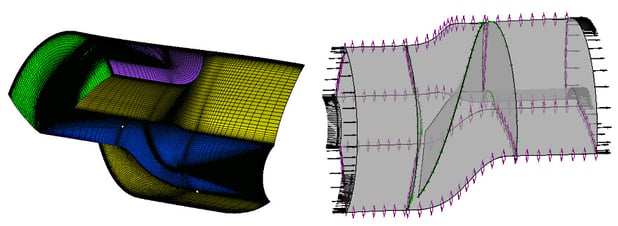
Figure 5: Baseline fan CFD setup
Baseline Fan – Results
The various results for the baseline fan can be seen in Figure 6. While TURBOdesign1 performance parameters indicate a high diffusion ratio, CFD results clearly show that both total-to-total and total-to-static efficiency levels are much lower than the meanline code estimation of 92% and 30% respectively. Therefore there is much scope for improvement in performance.
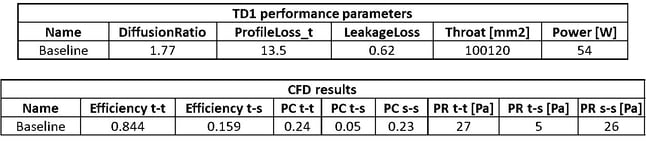
Figure 6: Baseline fan results
Redesign 1
A parametric study was started on the baseline fan, and in the first redesign, the forced vortex distribution for spanwise rVt* was retained, and only the blade loading was changed to fore-loaded at both hub and shroud, as shown in Figure 7. The relative velocity plots from the inviscid flow analysis in TURBOdesign1 clearly show that the hub loading is increased in the front portion and reduced in the aft portion because of this change in blade loading. In terms of performance, there is a slight reduction in diffusion and profile loss parameters and a corresponding increase in the total-to-total efficiency and pressure rise levels in the CFD results. However, this is still very far from the meanline code target of 92%.
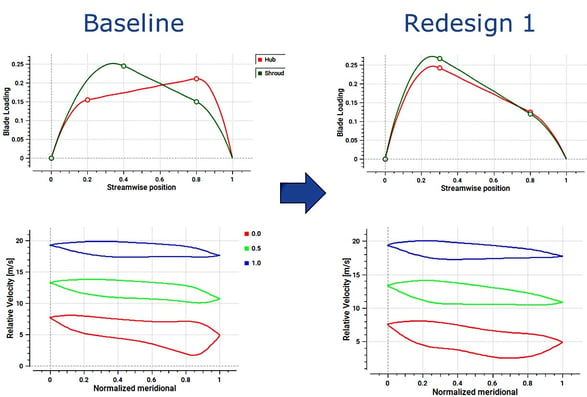
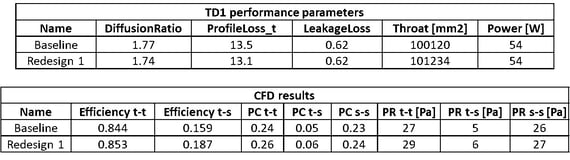
Figure 7: Comparison between baseline and redesign 1
Redesign 2
In the second redesign shown in Figure 8, while the forced vortex rVt* distribution was still maintained, the leading edge loading was increased in order to design with positive incidence (zero leading edge loading results in zero incidences). This is also reflected in the relative velocity plots, where a gap appears at the leading edge throughout the span. This results in further reduction in profile and leakage loss parameters along with some improvement in the total-to-total efficiency, but it is still far from the meanline target.
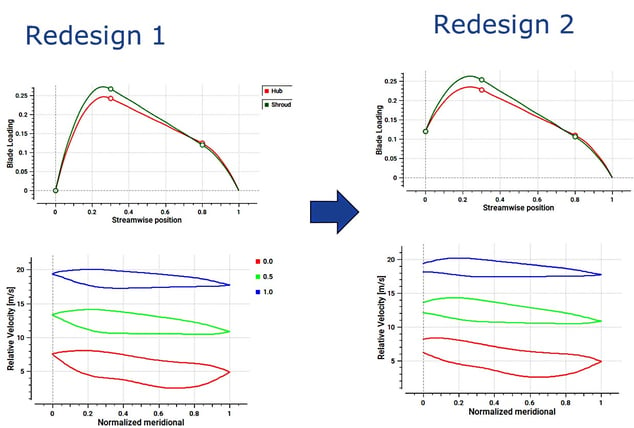
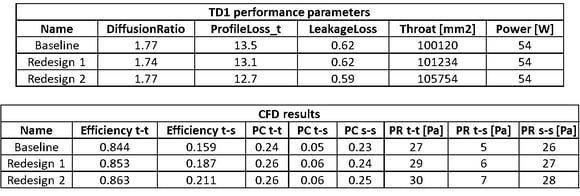
Figure 8: Comparison between redesign 1 and redesign 2
Redesign 3
Figure 9 shows the last step of manual redesign, where the spanwise rVt* distribution is changed from forced vortex to parabolic while maintaining the same blade loading as in redesign 2. The relative velocity distribution can be seen to change only very slightly from redesign 2 because the blade loading was not modified. In fact, this has quite a major effect on the results. This reduces both the profile and leakage loss parameters, and as a result, it significantly improves the efficiency and pressure rise levels. This is because leakage has a major effect in such types of fans, and unloading the tip region using the parabolic spanwise rVt* distribution reduces the tip leakage losses which has a major effect on the overall efficiency. It can be observed that the total-to-total efficiency is now very close to the meanline target of 92%, while the total-to-static efficiency is even higher than the meanline target of 30%.
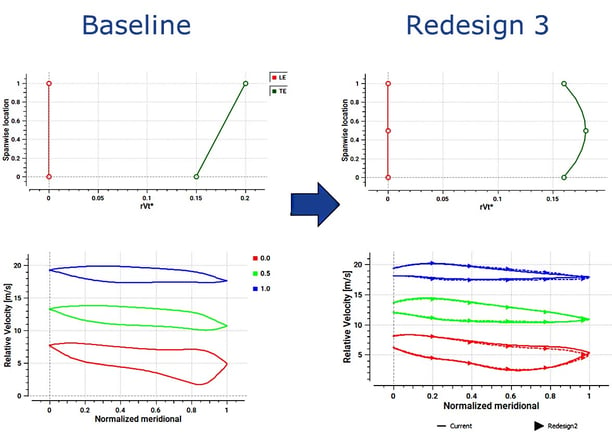
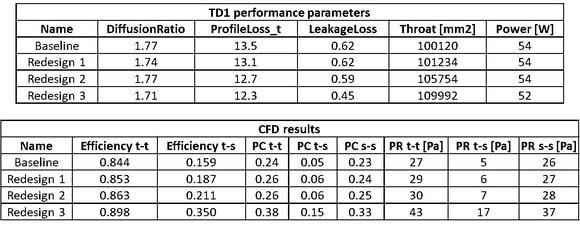
Figure 9: Comparison between baseline and redesign 3
Here's a Live Demo of the Baseline Geometry and Manual Redesigns with 3D Inverse Design
Conclusion
The above parametric study demonstrates that there are three main criteria for blade loading in axial fans to produce high performance:
- Streamwise loading distribution should be fore-loaded at both hub and shroud
- Positive leading edge loading should be applied
- A parabolic spanwise distribution to reduce hub and shroud work should be used
Following these guidelines, high-performance axial fans can be reliably and quickly produced using manual redesign in TURBOdesign1. In fact, there is a lot of generality about this type of loading because it works regardless of the fan speed or size and therefore can be considered the best practice of sorts. The study also proves that the inviscid flow parameters from TURBOdesign1 correlate strongly with the viscous performance predictions from CFD.
In another article, we demonstrate how the performance of redesign 3 can be enhanced even more through the application of automatic optimization in TURBOdesign1.

Book a LIVE demo on the design of a turbomachinery application of your choice.
Our demo is tailored to your specific application and design challenges

Share This Post