In this post we look at designing an axial fan by the 3D Inverse Design method. The entire design process includes controlling the blade loading to create an initial design, then performing CFD analysis and further optimization.
Axial fans are widely used in the formation of air transport systems because of its simple structure. Its applicable areas include HVAC, vehicles, home appliances, computers and electronic appliance coolers, and it is usually used in ventilation and air cooling systems. As axial fans are widely used in home appliances and computers, functional improvement and noise reduction have become a critical issue in small axial fan designs. Traditional designing methods require much trial and error along with a designer’s experience for the design of the blade.
The design controls the shape of the blades so there needs to be a precise appreciation of the decisive factors of the shape. In the inverse design method, blade loading is directly controlled to select the shape; therefore it is possible to reduce the time used for design modifications. By controlling the blade loading distribution it's possible to make significant improvements in fan efficiency and performance.
In this blog, we will discuss how an axial fan was designed by the 3D inverse design method. The designed blade shape was put to CFD (computational fluid dynamics) for performance prediction. The DOE (design of experiments) method was used to analyze the effects of the designing parameters on the functionality of the fan. The optimum design of the blade shape was obtained with parameters screened with the DOE method. Finally, we discuss the inverse design, CFD and optimization in the process of the overall design.
Design Process
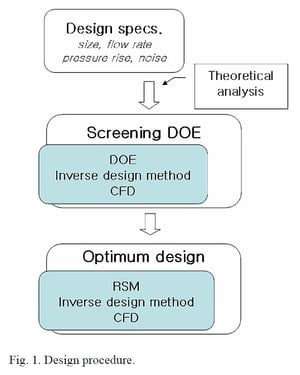
The design process is as shown in Fig. 1. When the design specifications are decided, the validity is examined through theoretical analysis. The parameters for the inverse design program are decided for parameter screening, and the testing set is designed by DOE. The testing set is applied to the inverse design program to decide the shape, and CFD is used to predict the performance.
The predicted results from CFD are analyzed by DOE to be applied in parameter screening for optimum design. The results are put through RSM (response surface method) for optimum designing, and the final shape is selected to satisfy the designing objectives. TURBOdesign1, a turbomachinery optimization design software that uses inverse design, was used along with ANSYS CFX-11 for CFD and MINITAB R14 for DOE.
Design Specification
In a fan-applicable system, whether the fan meets the functional requirements is the reference for overall performance and safety level of the system. Therefore a theoretical reasoning process on the functional requirements of the fan must be carried out first. The subject is a cooling fan for the condenser of the vapour compression cooling system; 120 (W)×120 (L) mm in size, 57% hub-tip ratio, 4 m3/min (CMM) of design volume flow rate, 100 Pa pressure.
The basic shapes of conventional turbomachinery are decided by the size and its functional requirements, and the subject is a conventional propeller type. Research on commercial fans which meet the design requirements showed that compared to conventional fans of the same size, they are of higher pressure per-flow rate, with 6000 RPM and 65 dBA noise level. Considering the fact that the subject fan is used for a computer cooling system, the noise becomes a problem.
As a result, the designing object was set to design a highly functional and efficient fan at the same RPM rate of commercial fans, and to reduce the number of revolutions to meet the functional requirements.
Inverse design parameters
In the inverse design method, loading distribution on the blades is modified to meet the required performance rate in deciding the fan shape. However, this method is not merely about inputting desired designing conditions perfectly to get a desired optimum design. It controls the overall designing direction in loading on the blades, therefore making it easier to predict or control the outcome compared to traditional designing methods. Therefore, the quality and efficiency of the design are improved by influence analysis of the parameters that could have an effect on shaping the fan.
Learn more about the 3D Inverse Design method
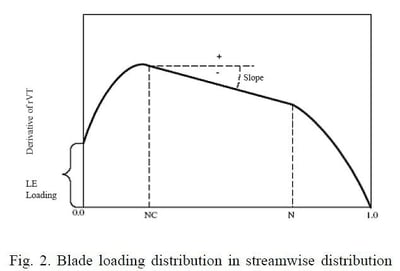
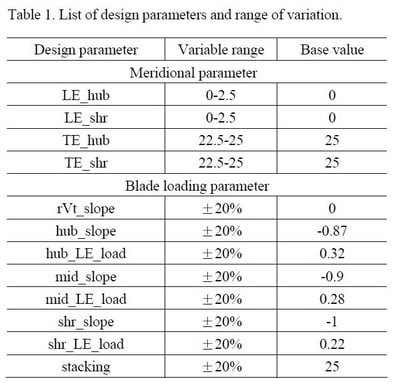
The designing parameters and the variable range are shown in Table 1 are largely divided into meridional shapes and blade loading distributions. In meridional shapes, the position of axial directions of hub and shroud are changed in the leading edge (LE) and trailing edge (TE). The blade loading distribution is divided into spanwise and streamwise distribution. In the case of spanwise distribution, it was expressed by the blade loading slopes of hub and shroud at TE (rVt_slope). Fig. 2 displays midspan and shroud, the starting and ending points of the straight part (NC and ND), and the slope of the straight part.
The research results on the inverse design of box fans which are of a similar specific speed range were used for distributional reference of blade loading in a streamwise direction. NC and ND are fixed in the distribution, and the loads on LE of hub, midspan and shroud were selected as parameters, along with the slope of the straight part. Stacking, which is an important parameter in traditional axial fan design, was also included as a parameter.
Screening DOE
Parameter screening is an important step in judging the influence level of parameters at an early stage of design. To analyze the influence of the 12 design parameters shown in Table 1 on overall performance, the parameter range was changed to 2k level; in this case, 4096 probability cases exist.
However, DOE can notably decrease the number with a bit of assumption. This study applied the 2k fractional factorial design, with 32 design sets of resolution level 4. The Y-value is the reference for analyzing the results in examining the influence of parameters. Standard values in fan functionality include static pressure rise and efficiency at the design flow rate.
Inverse design and CFD
The design parameter set decided by DOE were inserted into the inverse design program to get a converged shape. The designed shape is transformed into the input value for the turbomachinery specific grid generator (ANSYS CFX-TurboGrid v11); 80,000 structured grids were created for analysis.
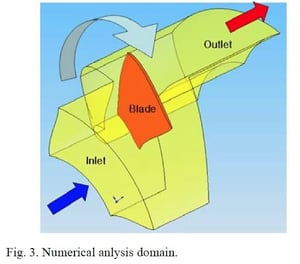
Numerical analysis was carried out by ANSYS CFX-11, a commercial CFD code. The numerical domain included only the fluid flow regimes with one blade while taking periodic condition into consideration, as shown in Fig. 3. In the entrance and the exit, the meridional planes are extended in the axial direction.
Atmospheric pressure conditions were applied to the entrance and mass flow conditions to the exit. The blade and hub are set to rotating wall condition, and the stationary shroud to non-rotating wall condition. The tip clearance between the rotating blade and the case was not taken into consideration. Rises in static pressure and static efficiency at the flow rate of design conditions were calculated from the numerical analysis results and were used as the Y-value of DOE.
Optimization
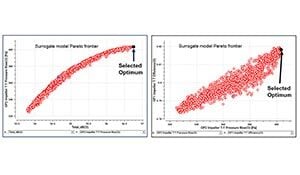
Optimum design parameters were selected through parameter screening, and design set was chosen through RSM. A 3-parameter central composite method from response surface method was used and the cube model (CCC, central composite circumscribed) was applied. The cube model, in the case of the 3-parameter method, is where the parameter ranges are the vertexes of a hexahedron, and the range is increased until the circumscribed sphere meets the axis.
The overall design set consists of 20, including 5 sets of repeated central values. The set inserts the parameter values into the inverse design program in the same manner of screening DOE, then calculates the Y-value through CFD. The BEP (best efficiency point) flow rate was added to the Y-value to design the highest efficiency at design condition, along with rises in static pressure and static efficiency; the result is shown in Fig. 4.
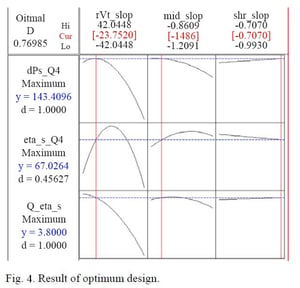
When multiple Y-values exist, it is difficult to carry out an optimum design which meets the requirements of all values. If this is the case, the weighted value is added to the Y-value. In this study, not only functionality but also noise is an important issue, so the number of revolutions was decreased to aim for noise reduction.
For the final Y-value, the rise in static pressure and the flow rate of BEP was set to the maximum for the RSM design set, and a midpoint value for static efficiency. The weighted values for the Y-value were applied in the order of the rise of static pressure, efficiency maintenance, and flow rate at BEP. In the optimum design results of Fig. 4, the two parameters excluding shr slope show a curve effect. This can be interpreted as having an optimum value.
The overall desirability level at optimum design results is 0.76985 and the static pressure rise and BEP flow rate are both satisfactory, with the exception of efficiency. However in the case of desirability, although it is a reference for the satisfactory level of design requirements, a subjective.
Book a LIVE demo on the design of a turbomachinery application of your choice.
Our demo is tailored to your specific application and design challenges

Share This Post